Introduction
Overview
Here we provide a worked example of a ‘simple’ discovery analysis workflow, where the entire process (data prep, clustering, dimensionality reduction, cluster annotation, plotting, summary data, and statistical analysis) is contained within a single script. The ‘simple’ workflow is most suitable for fast analysis of small datasets. For larger or more complex datasets, or datasets with multiple batches, we recommend the general discovery workflow, where the data preparation, batch alignment, clustering/dimensionality reduction, and quantitative analysis are separated into separate scripts. The demo dataset used for this worked example are cells extracted from mock- or virally-infected mouse brains, measured by flow cytometry.
Strategy
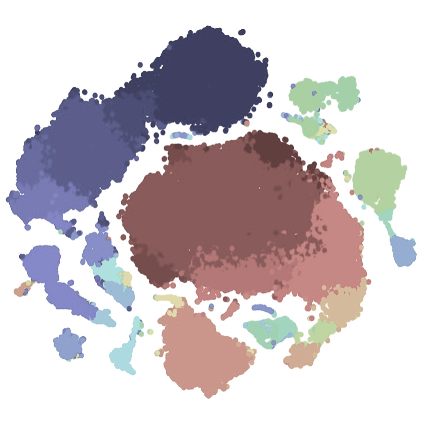
The ‘simple’ and ‘general’ discovery workflows are designed to facilitate the analysis of large and complex cytometry datasets using the Spectre R package. We’ve tested up to 30 million cells in a single analysis session so far. The workflow is designed to get around the cell number limitations of tSNE/UMAP. The analysis starts with clustering with FlowSOM – which is fast and scales well to large datasets. The clustered data is then downsampled, and dimensionality reduction is performed with tSNE/UMAP. This allows for visualisation of the data, and the clusters present in the dataset. Once the possible cell types in the datasets have been explored, the clusters can be labelled with the appropriate cellular identities. Finally, we can use the clusters/populations to generate summary statistics (expression levels, frequencies, total counts etc), which allows us to create graphs and heatmaps, facilitating statistical analysis.
Multiple samples
To analyse multiple samples, all the files must be imported into the one analysis session. This allows cells from each session to be clustered and analysed together, and allows us to examine the differential expression of markers, or the differences in cell proportions, between experimental groups.
Batch alignment
The ‘simple’ discovery workflow does not include any batch alignment steps. If batch correction needs to be applied, we recommend using the general discovery workflow.


Citation
If you use Spectre in your work, please consider citing Ashhurst TM, Marsh-Wakefield F, Putri GH et al. (2020). bioRxiv. 2020.10.22.349563. To continue providing open-source tools such as Spectre, it helps us if we can demonstrate that our efforts are contributing to analysis efforts in the community. Please also consider citing the authors of the individual packages or tools (e.g. CytoNorm, FlowSOM, tSNE, UMAP, etc) that are critical elements of your analysis work. We have provided some generic text that you can use for your methods section with each protocol and on the ‘about’ page.
Sample methods blurb
Here is a sample methods blurb for this workflow. You may need to adapt this text to reflect any changes made in your analysis.
Computational analysis of data was performed using the Spectre R package (Ashhurst et al., 2020), with instructions and source code provided at https://github.com/ImmuneDynamics/spectre. Samples were initially prepared in FlowJo, and the population of interest was exported as raw value CSV files. Arcsinh transformation was performed on the data in R using a co-factor of 15 to redistribute the data on a linear scale and compress low end values near zero. The dataset was then merged into a single data.table, with keywords denoting the sample, group, and other factors added to each row (cell). The FlowSOM algorithm (Van Gassen et al., 2015) was then run on the merged dataset to cluster the data, where every cell is assigned to a specific cluster and metacluster. Subsequently, the data was downsampled and analysed by the dimensionality reduction algorithm Uniform Manifold Approximation and Projection (UMAP) (McInnes, Healy, Melville, 2018) for cellular visualisation.
Software and R script preparation
Software: for instructions downloading R, RStudio, and Spectre, please see this section on the home page.
Analysis script: Please visit https://github.com/ImmuneDynamics/Spectre, and download the repository:

You can then find the ‘simple discovery workflow’ script here:

Create a folder for your experiment, and place the script in that folder.
Code Code Code
More code