COMPUTATIONAL ANALYSIS: here we provide resources to facilitate computational analysis of high-dimensional cytometry data, including Spectre, an R package that enables comprehensive end-to-end integration and analysis of high-dimensional cytometry data from different batches or experiments.
- Talk on clustering and dimensionality reduction at the ACS ‘homeshow’: Youtube.
- Paper on key considerations for generating high-quality data for analysis in high-dimensional cytometry: Marsh-Wakefield et al, 2021.
Resources developed by our group
|
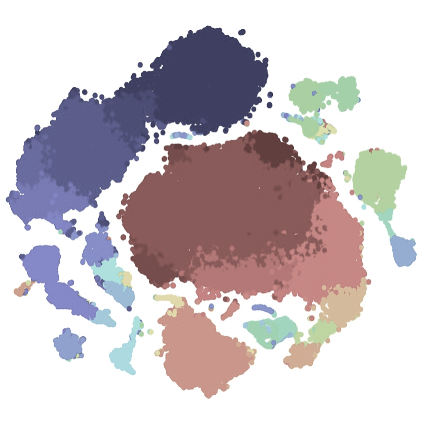
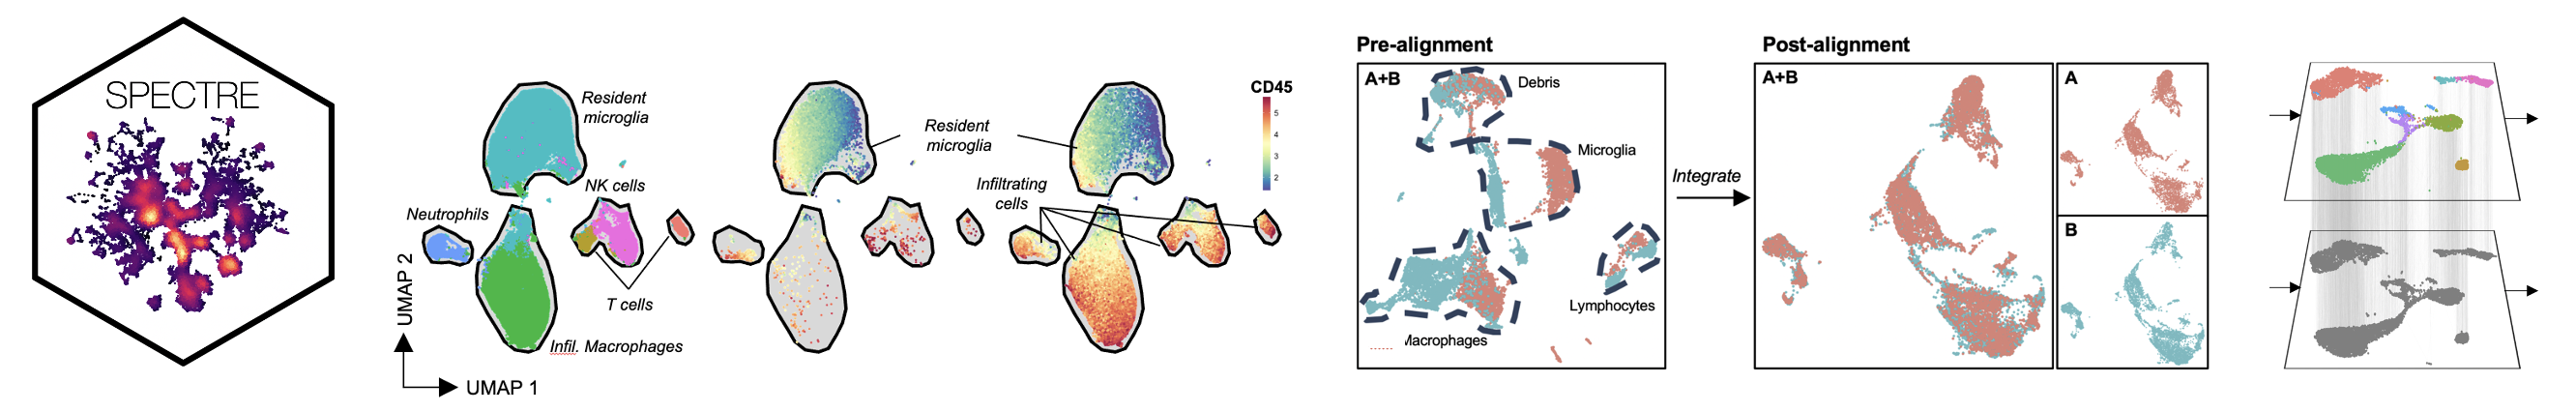
Spectre R packageSpectre is an R package and computational toolkit that enables comprehensive end-to-end integration, exploration, and analysis of high-dimensional cytometry data from different batches or experiments. Spectre streamlines the analytical stages of raw data pre-processing, batch alignment, data integration, clustering, dimensionality reduction, visualisation and population labelling, as well as quantitative and statistical analysis; with a simple, clear, and modular design of analysis workflows, that can be utilised by data and laboratory scientists. You can find out more from the Spectre home page (below) or from our pre-print: Ashhurst*, Marsh-Wakefield*, Putri* et al. (2021). Cytometry A (accepted). GO TO PAGE |

|
Clustering and dimensionality reduction approaches in FlowJoHere we provide a protocol for performing clustering and dimensionality reduction using FlowJo, following Spectre's 'Discovery Analysis' workflow. GO TO PAGE |
|
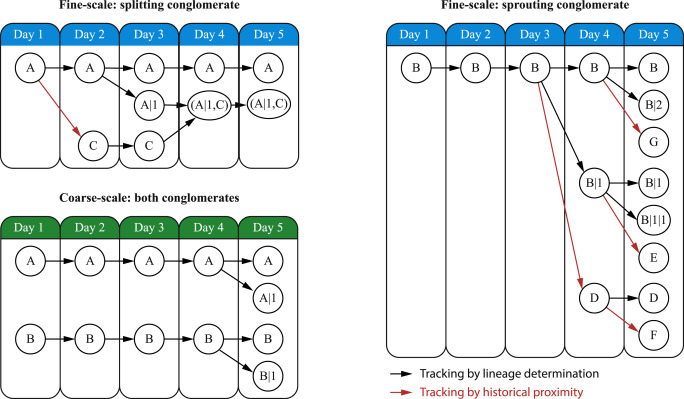
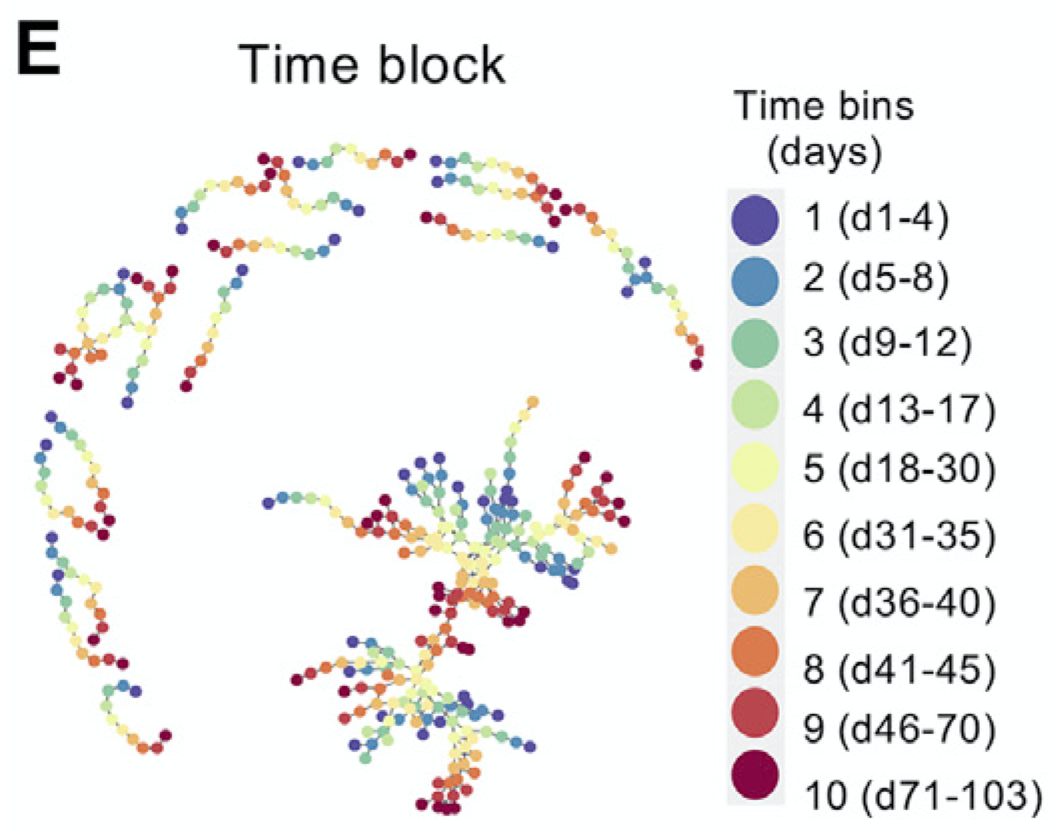
ChronoClustA novel clustering and cluster tracking algorithm specifically designed to cluster and track cellular populations in temporal cytometry data. For each time-point, ChronoClust uses density based clustering algorithms which cluster cells into microclusters (MCs) and thereafter daisy-chained those MCs to form clusters. The evolution of clusters are then tracked by the virtue of their MCs over time. GO TO PAGE |
|
TrackSOMA temporal clustering and tracking algorithm which fuses ChronoClust’s tracking methodology with the clustering prowess of FlowSOM. In summary, TrackSOM amalgamates data from all time-point into one dataset, and thereafter cluster them using the Self Organising Map (SOM). For each time-point, TrackSOM then isolates the non-empty SOM nodes for that time-point, and perform consensus hierarchical clustering on them. Tracking of the resulting meta-clusters then ensues, by virtue of the SOM nodes. GO TO PAGE |
Analysis resources from Mass Cytometry: Methods and Protocols. HM McGuire, TM Ashhurst (eds). 2019. Springer New York
- Data-Driven Flow Cytometry Analysis (Sherrie Wang, Ryan R. Brinkman): chapter.
- Analysis of Mass Cytometry Data (Christina B. Pedersen, Lars R. Olsen): chapter.
- Analysis of High-Dimensional Phenotype Data Generated by Mass Cytometry or High-Dimensional Flow Cytometry (Branko Cirovic, Natalie Katzmarski, Andreas Schlitzer): chapter.
- Computational Analysis of High-Dimensional Mass Cytometry Data from Clinical Tissue Samples (Sam Norton, Roslyn Kemp): chapter.
- Supervised Machine Learning with CITRUS for Single Cell Biomarker Discovery (Hannah G. Polikowsky, Katherine A. Drake): chapter.
Resources developed by others

|
FlowSOMUsing self-organizing maps for visualization and interpretation of cytometry data. Published: Van Gassen et al. (2015). Cytometry A GO TO PAGE |
|
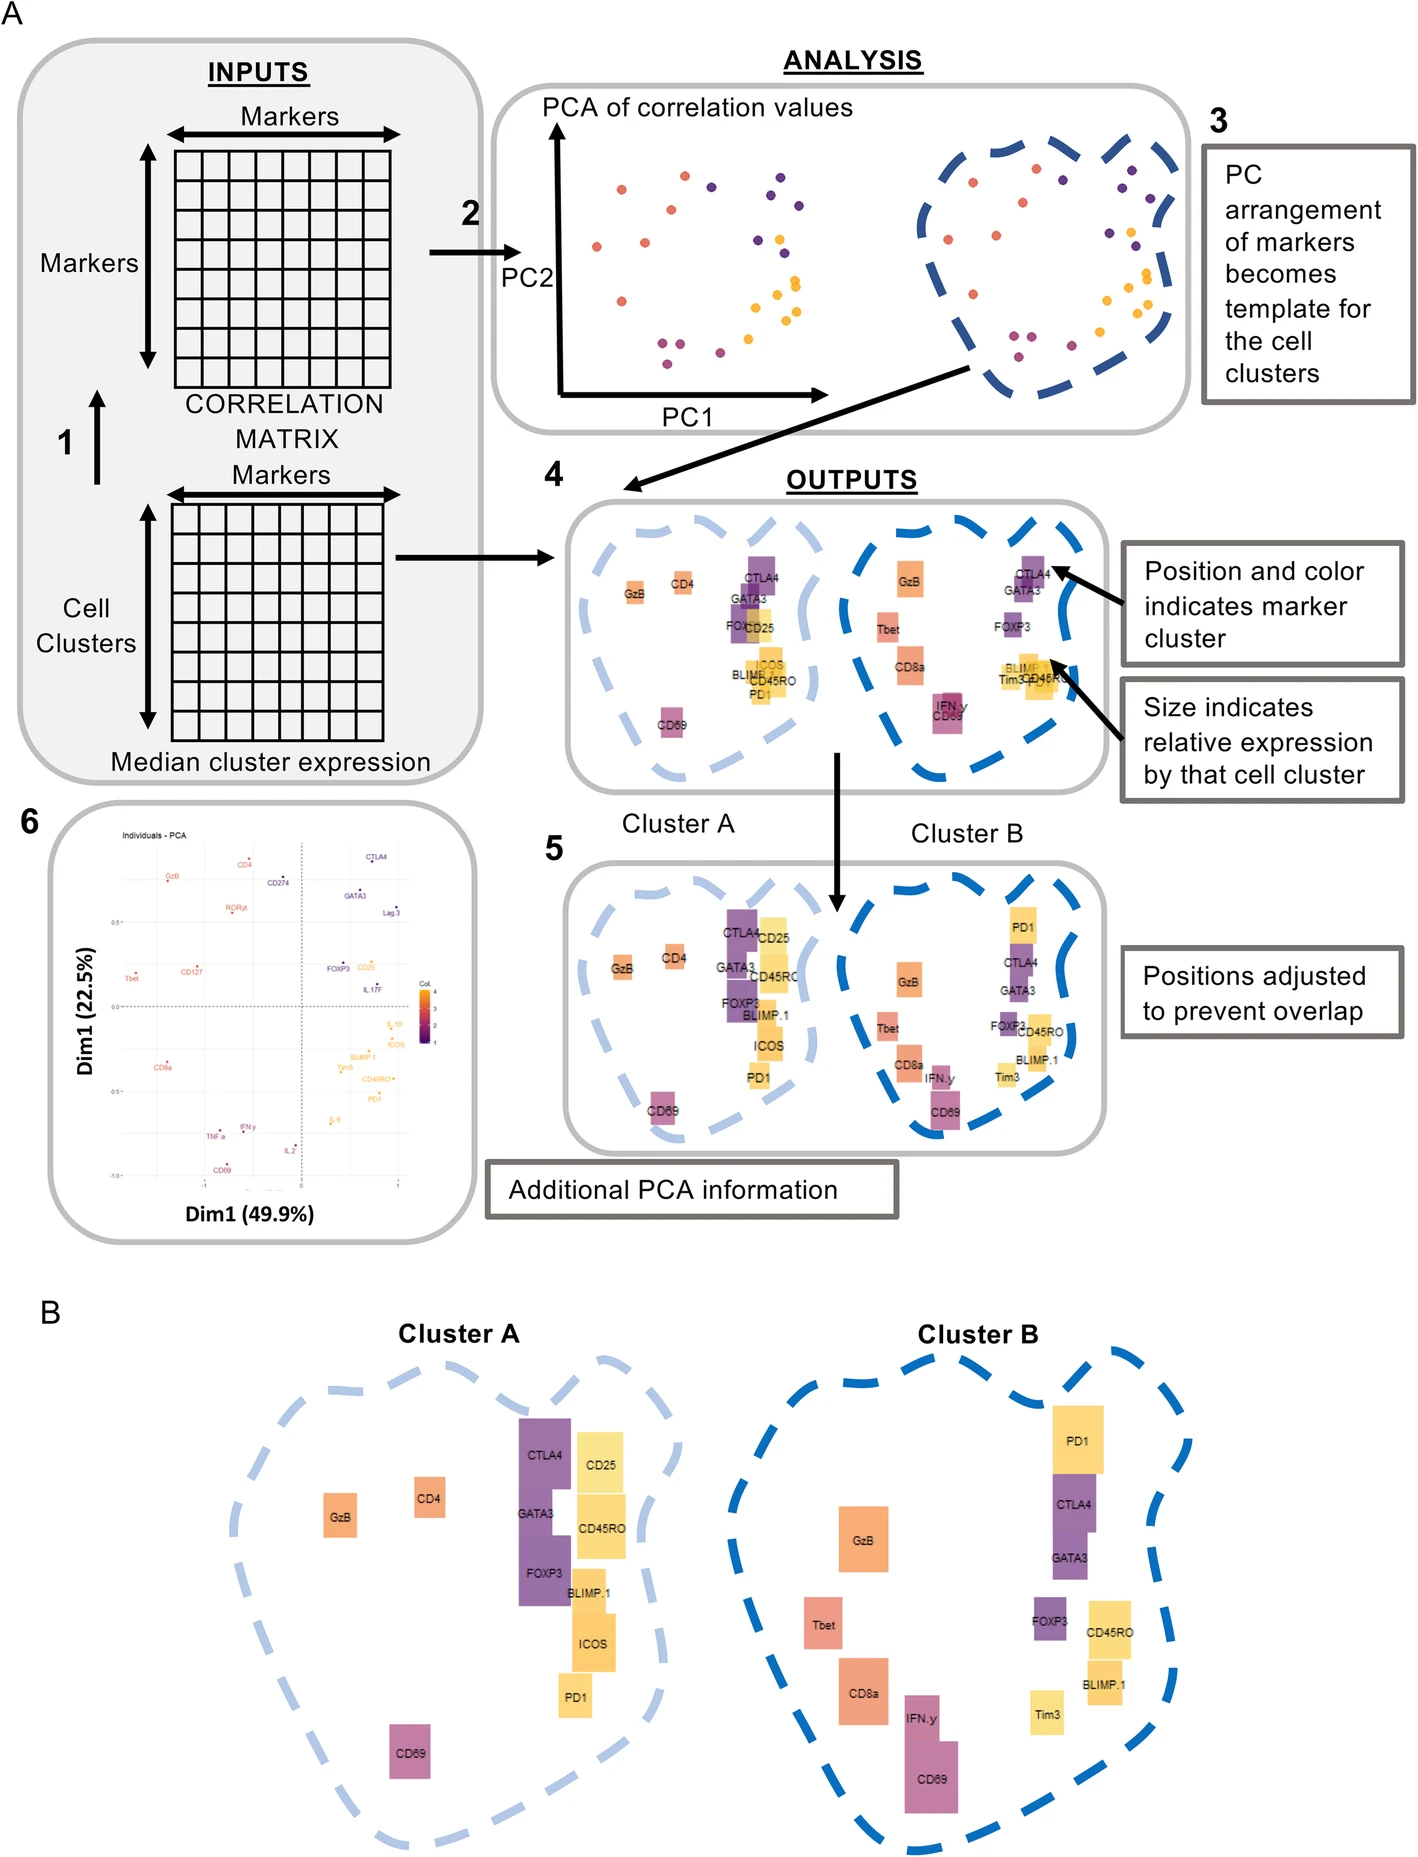
Brick plotsBrickPlots - a visualisation tool for clustered high dimensional cytometry data. The Brick plot method generates a two-dimensional barcode that displays the phenotype of each cluster in relation to the entire dataset. Brick plots can be used to visualize complex mass cytometry data, both from fundamental research and clinical trials, as well as flow cytometry data. Published: Norton et al. (2020). BMC Bioinformatics GO TO PAGE |